Reports and dashboards
The report builder answers questions the ready-made reports do not: "sales by customer by month", "unpaid bills over 30 days by vendor", "tickets per agent this quarter", "payroll cost by department". You pick the data, the columns and filters, group and total, show it as a table, a pivot or a chart, download it as CSV, save it, and have it emailed to you every morning, week or month. Saved reports then become widgets on dashboards that each role sees when they sign in. Reports and Dashboards are at the top of the sidebar; dashboards are set up under Settings → Report dashboards.
Who can do what. Running reports and viewing dashboards needs core.reports.view. Saving reports, scheduling emails, adding them to dashboards and editing dashboards needs core.reports.manage. Owners and admins have both; members can view. People only ever see data from modules your workspace has switched on.
The financial statements (profit and loss, balance sheet and so on) are separate: see Financial reports.
Build a report
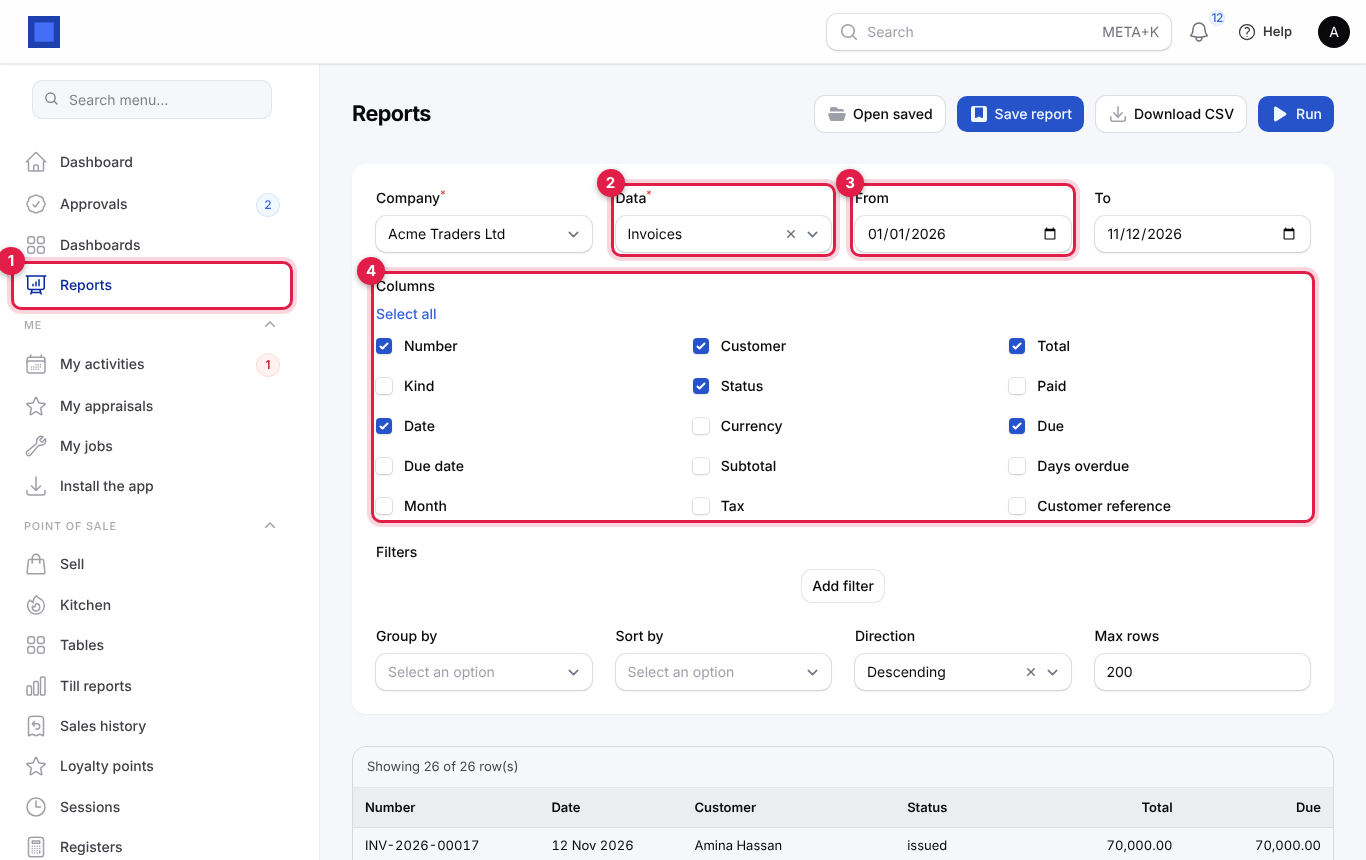
- Click Reports at the top of the sidebar (marker 1).
- Choose the Company and the Data (marker 2) to report on.
- Set the period with From and To (marker 3). They filter on the main date of the data (invoice date, payment date, bill date and so on). Leave them empty for all dates.
- Tick the Columns you want (marker 4). Select all ticks every one. The order of the columns follows the list.
The Data list depends on the modules you use:
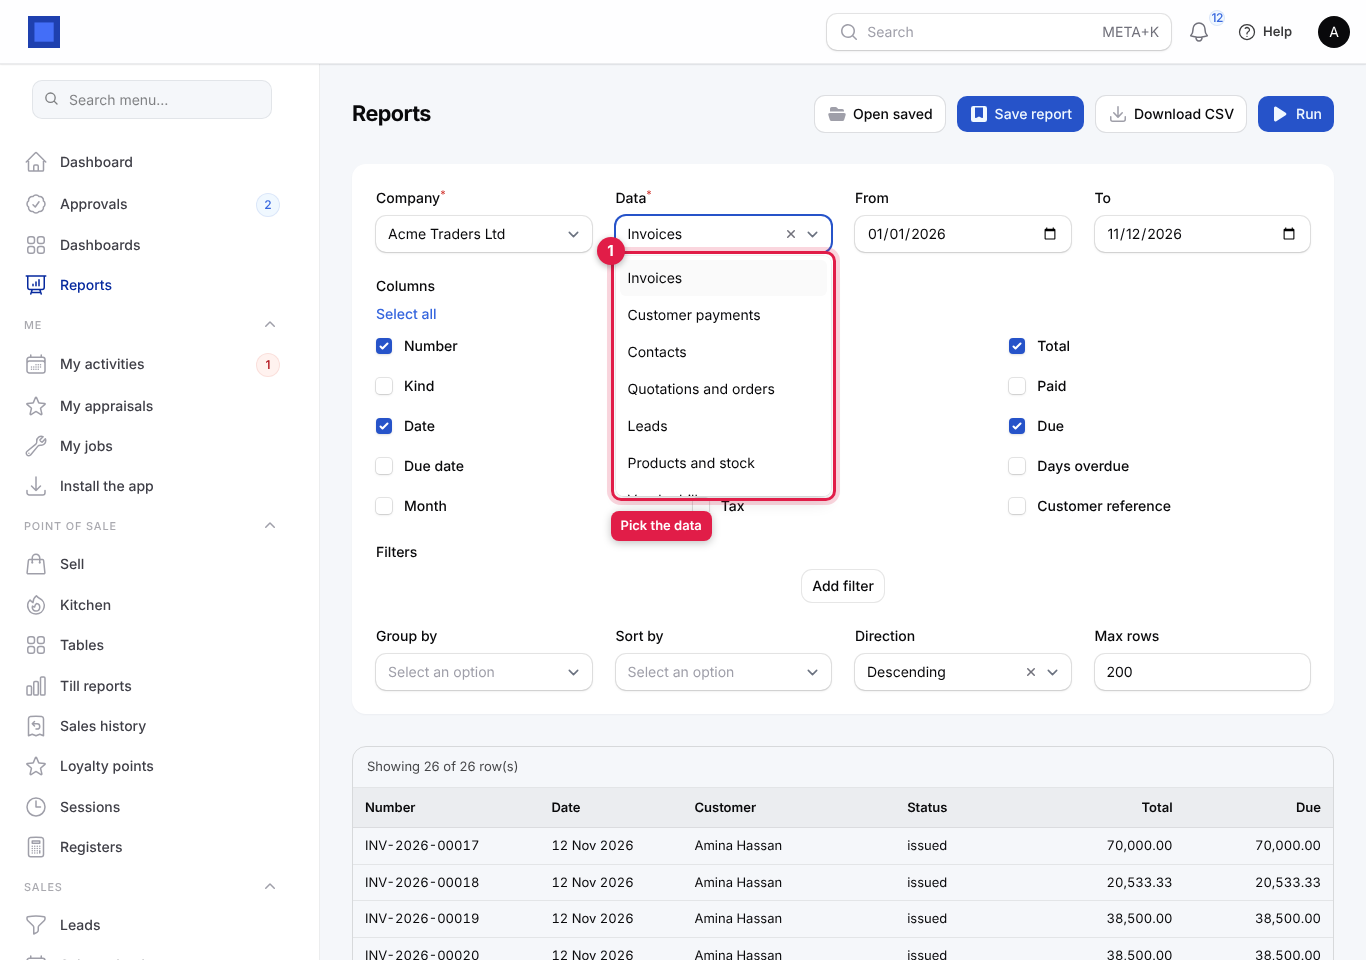
| Data | One row per |
|---|---|
| Invoices | Invoice and credit note: number, kind, date, due date, month, customer, status, currency, subtotal, tax, total, paid, due, days overdue, customer reference. |
| Customer payments | Payment received. |
| Contacts | Customer or vendor. |
| Quotations and orders | Quotation or sales order. |
| Leads | CRM lead. |
| Products and stock | Product with prices and stock on hand. |
| Vendor bills | Bill from a vendor. |
| Expenses and income | Expense, income or transfer recorded in Accounting. |
| Payroll | Payslip. |
| Till sales | Point of sale receipt. |
| Support tickets | Helpdesk ticket. |
| Timesheets | Time entry. |
- Click Run in the top right (marker 4 below). The results appear under the form: "Showing … of … row(s)" and a table with a Total row for the money columns.
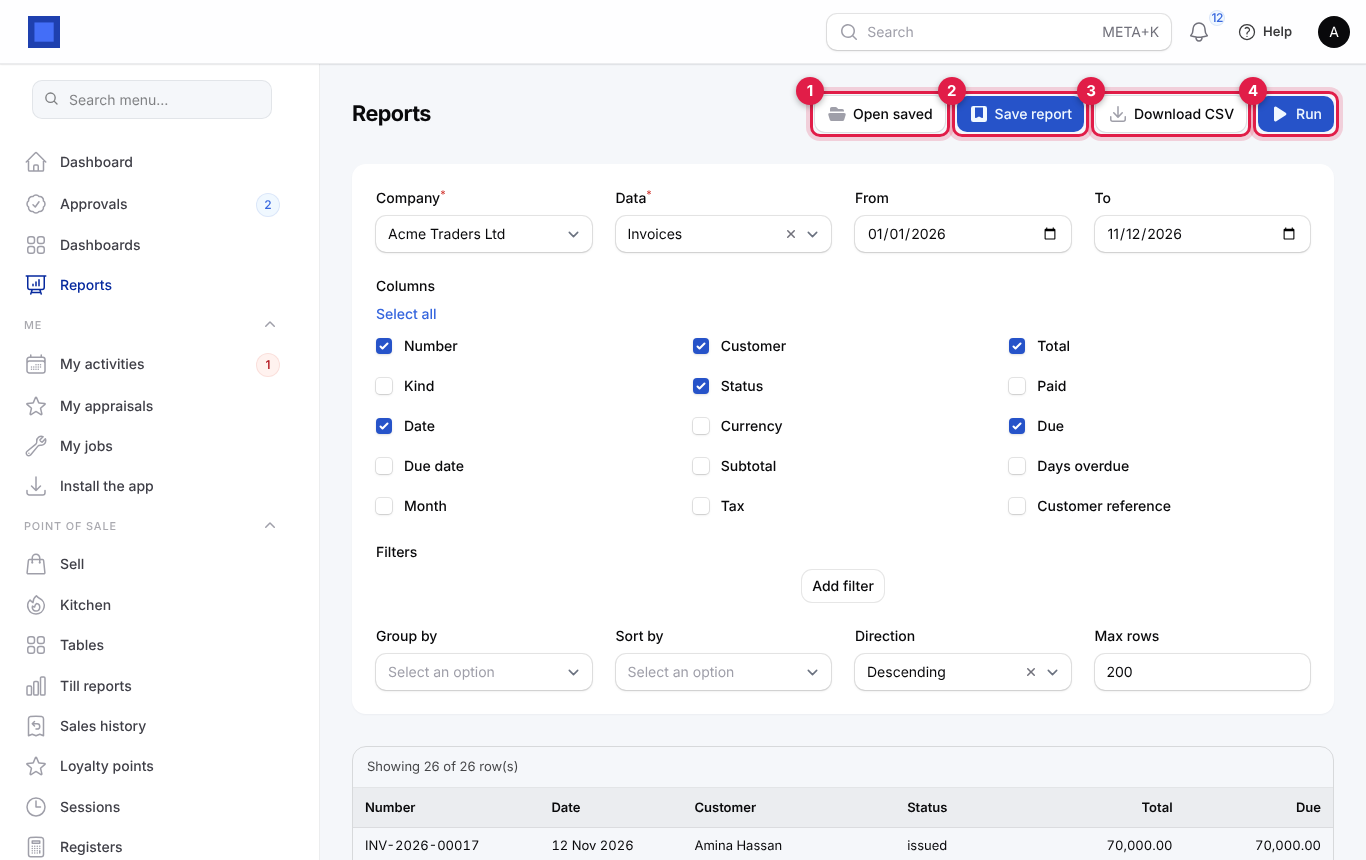
| Button | What it does |
|---|---|
| Open saved (marker 1) | Loads a saved report. Shown once at least one report is saved. |
| Save report (marker 2) | Saves the current settings under a name, optionally on an email schedule. After opening a saved report it is called Save changes and updates that report. |
| Download CSV (marker 3) | Downloads exactly what is on screen (table or pivot) as a CSV file for Excel or Google Sheets. |
| Run (marker 4) | Refreshes the results. |
| Add to a dashboard | Shown after you open or save a report: puts it on a dashboard (see below). |
Filter the rows
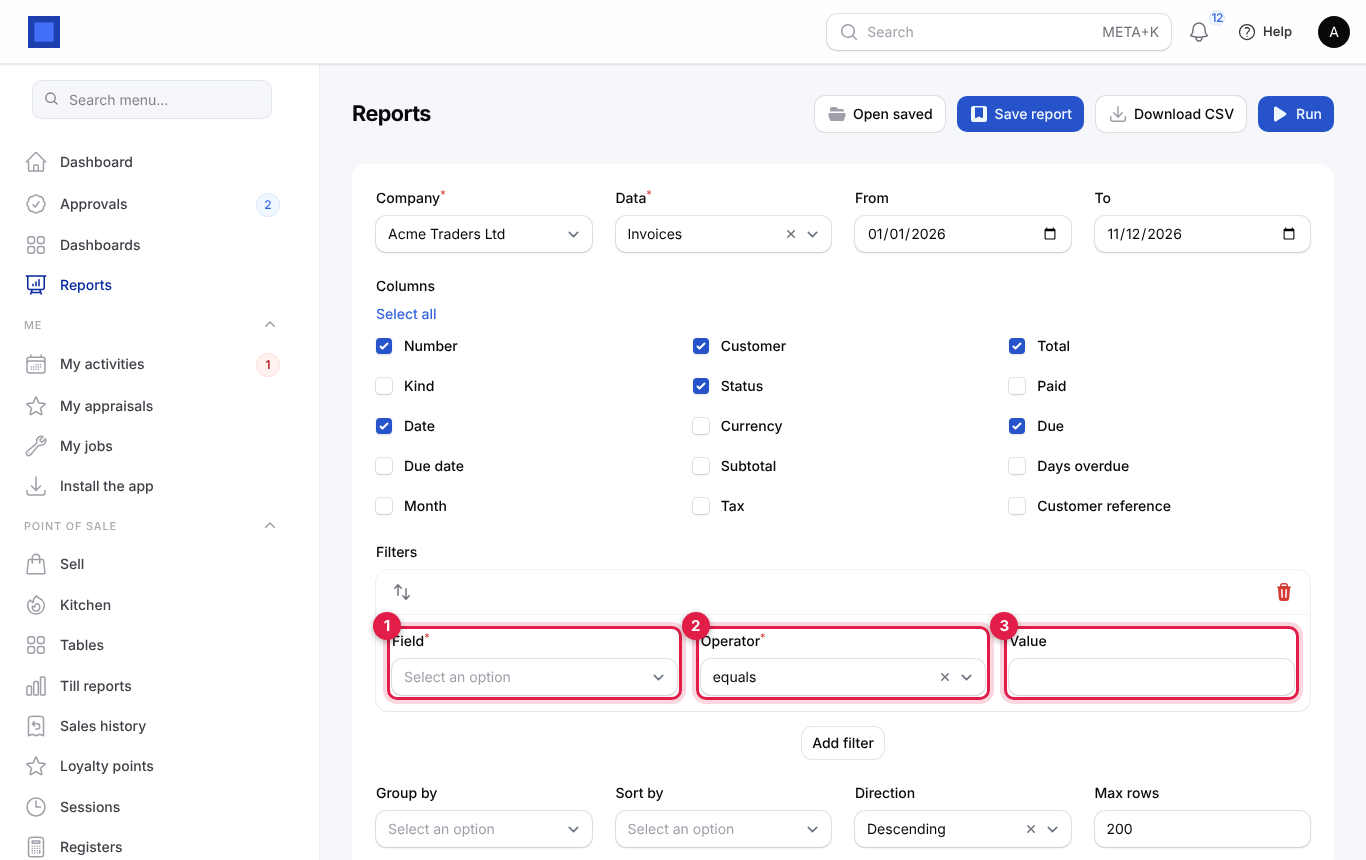
- Click Add filter under Filters.
- Choose the Field (marker 1), the Operator (marker 2) and type the Value (marker 3).
- Add more filters as needed; a row must pass all of them. The bin removes a filter.
| Operator | Use it for |
|---|---|
| equals / does not equal | Exact values, for example Status equals issued. |
| contains | Part of a text, for example Customer contains Tours. |
| greater than, at least, less than, at most | Numbers and dates, for example Days overdue at least 30. |
| is empty / is not empty | Missing or present values; no Value needed. |
Group, total, pivot and chart
Grouping turns rows into a summary: one line per customer, per status, per month.
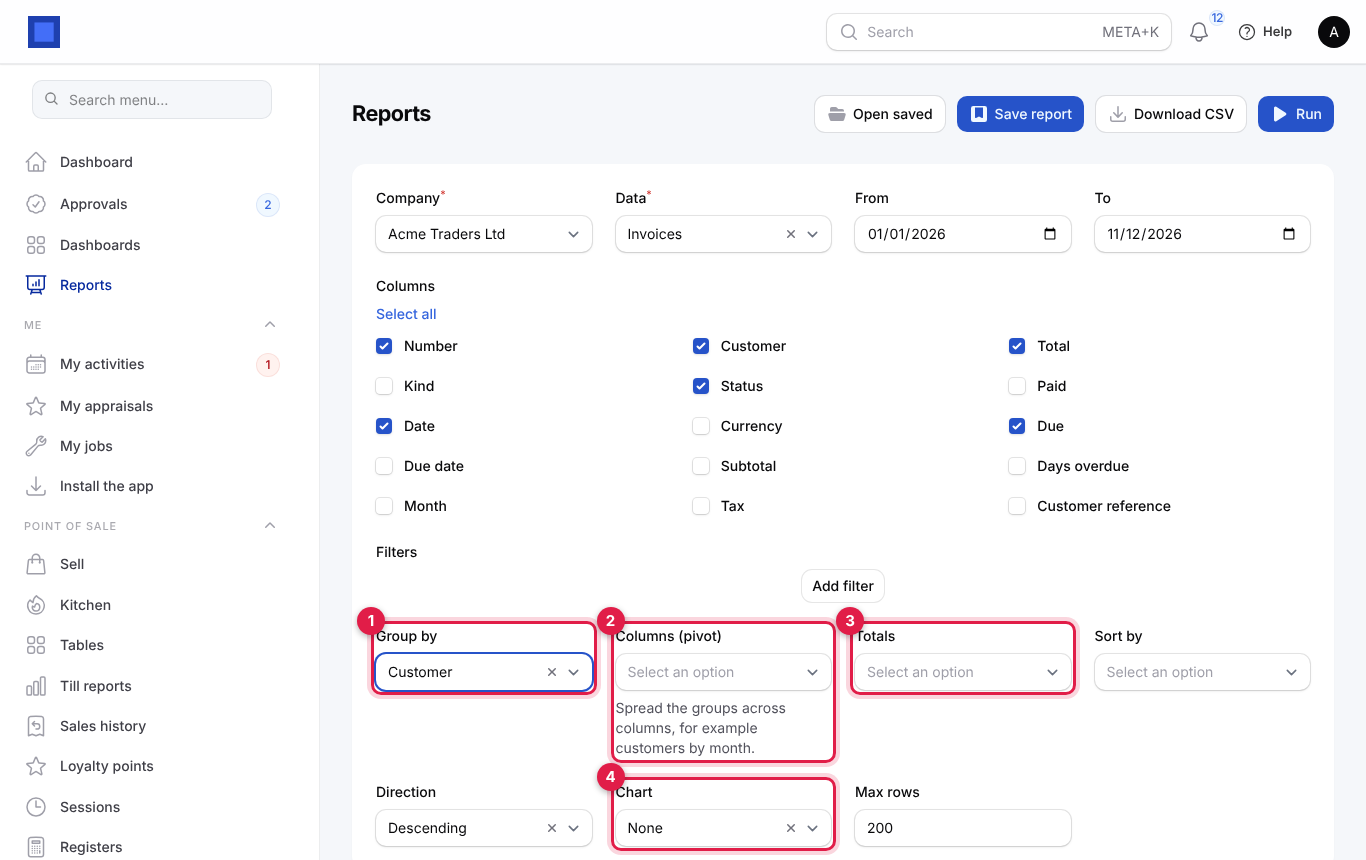
- Choose Group by (marker 1), for example Customer or Status. New fields appear.
- In Totals (marker 3), pick the number columns to add up per group, for example Total and Due. With none, each group shows its number of rows.
- To spread the groups across columns (a pivot), choose Columns (pivot) (marker 2), for example Date to get customers by month. A pivot totals the first of your Totals (or counts rows if there are none), and adds row and column totals.
- When grouping or pivoting by a date, Dates by appears: Day, Week, Month, Quarter or Year.
- Choose a Chart (marker 4): None, Bars, Pie or Line for a grouped report; Stacked bars or Lines for a pivot (pie is not offered for pivots).
- Use Sort by and Direction (Descending or Ascending) to order the rows, and Max rows (1 to 5,000, 200 by default) to limit them.
- Click Run.
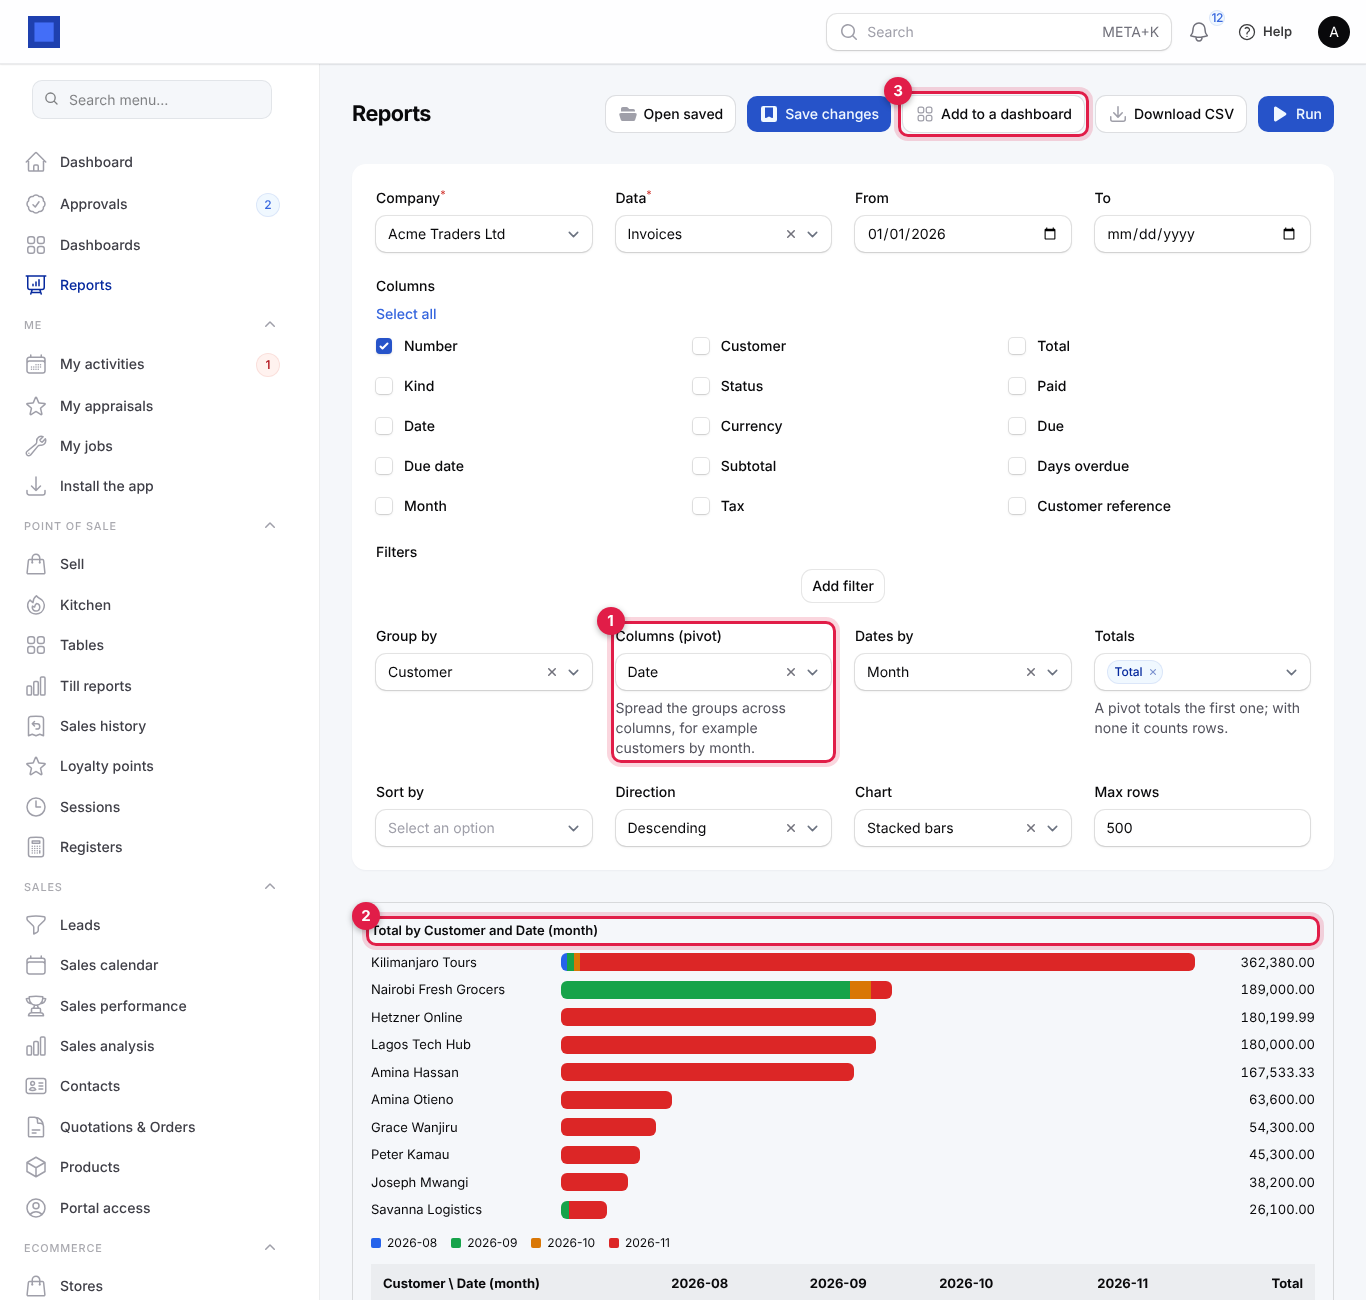
Here is a saved pivot, Sales by customer and month: Columns (pivot) is Date by month (marker 1), and the result (marker 2) shows a stacked bar chart and the table with a column per month and totals. Add to a dashboard (marker 3) appears because a saved report is open.
Save a report and have it emailed
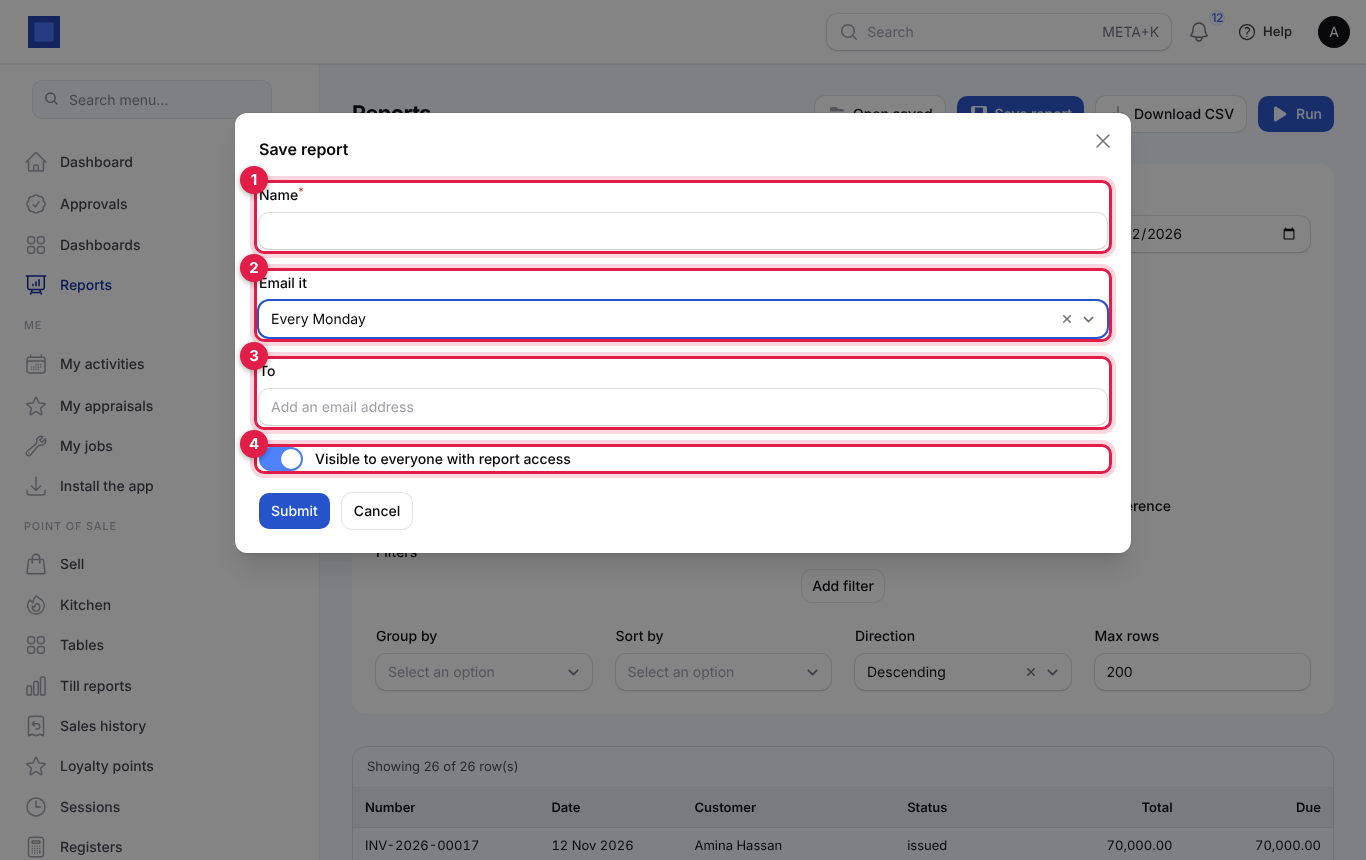
- Click Save report.
- Type a Name (marker 1), for example Outstanding invoices by customer.
- To have it emailed, choose Email it (marker 2): Never, Every morning, Every Monday or On the 1st of the month.
- In To (marker 3), type each recipient's email address and press Enter. They do not need a NaliSuite account.
- Leave Visible to everyone with report access on (marker 4) to share it with colleagues (in Open saved and on dashboards), or switch it off to keep it to yourself.
- Click Submit. "Report saved" confirms it.
Scheduled reports are sent early each morning when due: daily ones every morning, weekly ones on Monday, monthly ones on the 1st. Each email has your company name and colour, says how many rows the report has, lists the totals of the money columns, and attaches the full result as a CSV file. The dates in the saved report are kept as saved, so for a rolling report leave From and To empty or update them when needed.
Open a saved report
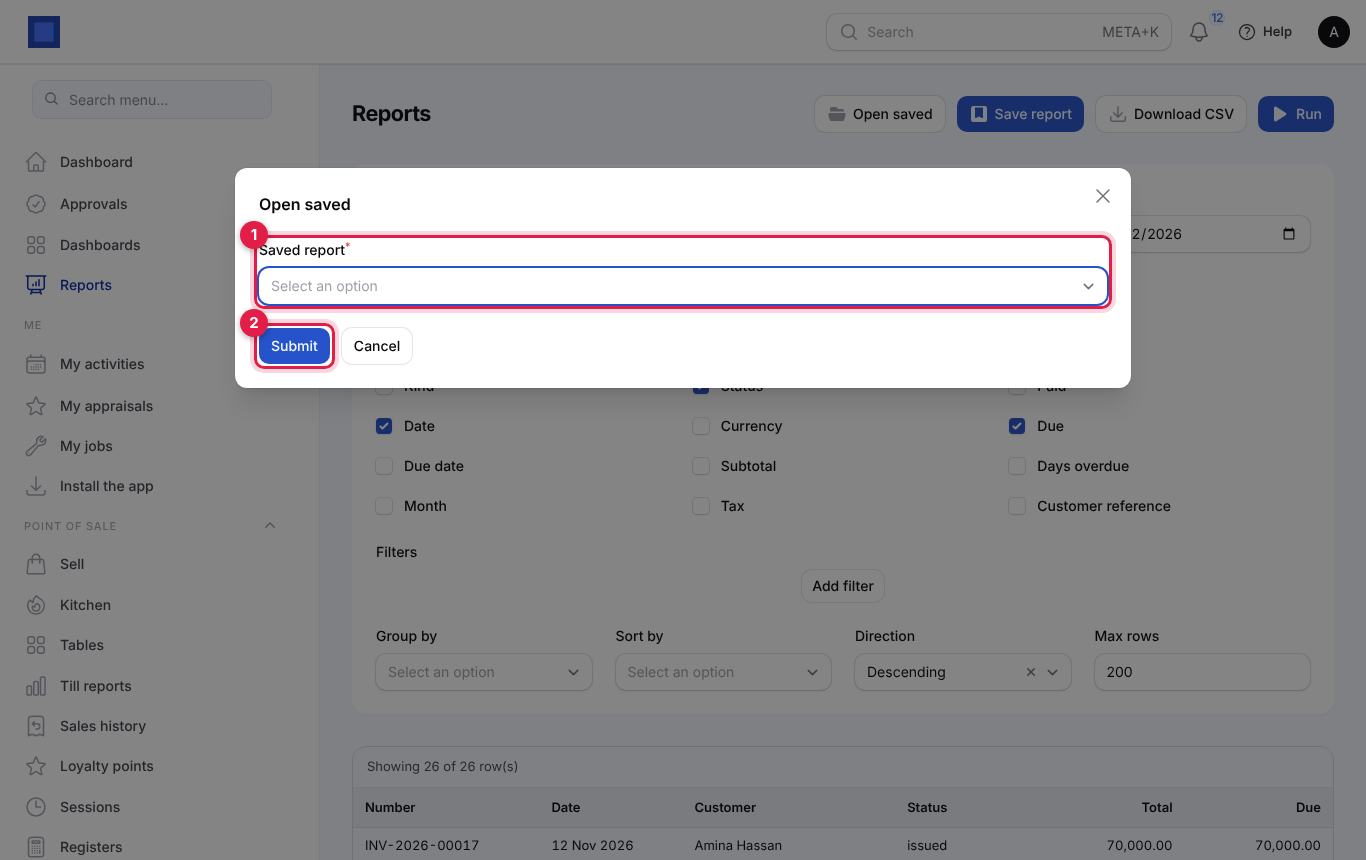
- Click Open saved.
- Choose the Saved report (marker 1) and click Submit (marker 2). All its settings are loaded and it runs.
Change anything and click Save changes to update it, or Save report… after reloading the page to save a copy under a new name.
Add a report to a dashboard
- Open (or save) the report.
- Click Add to a dashboard.
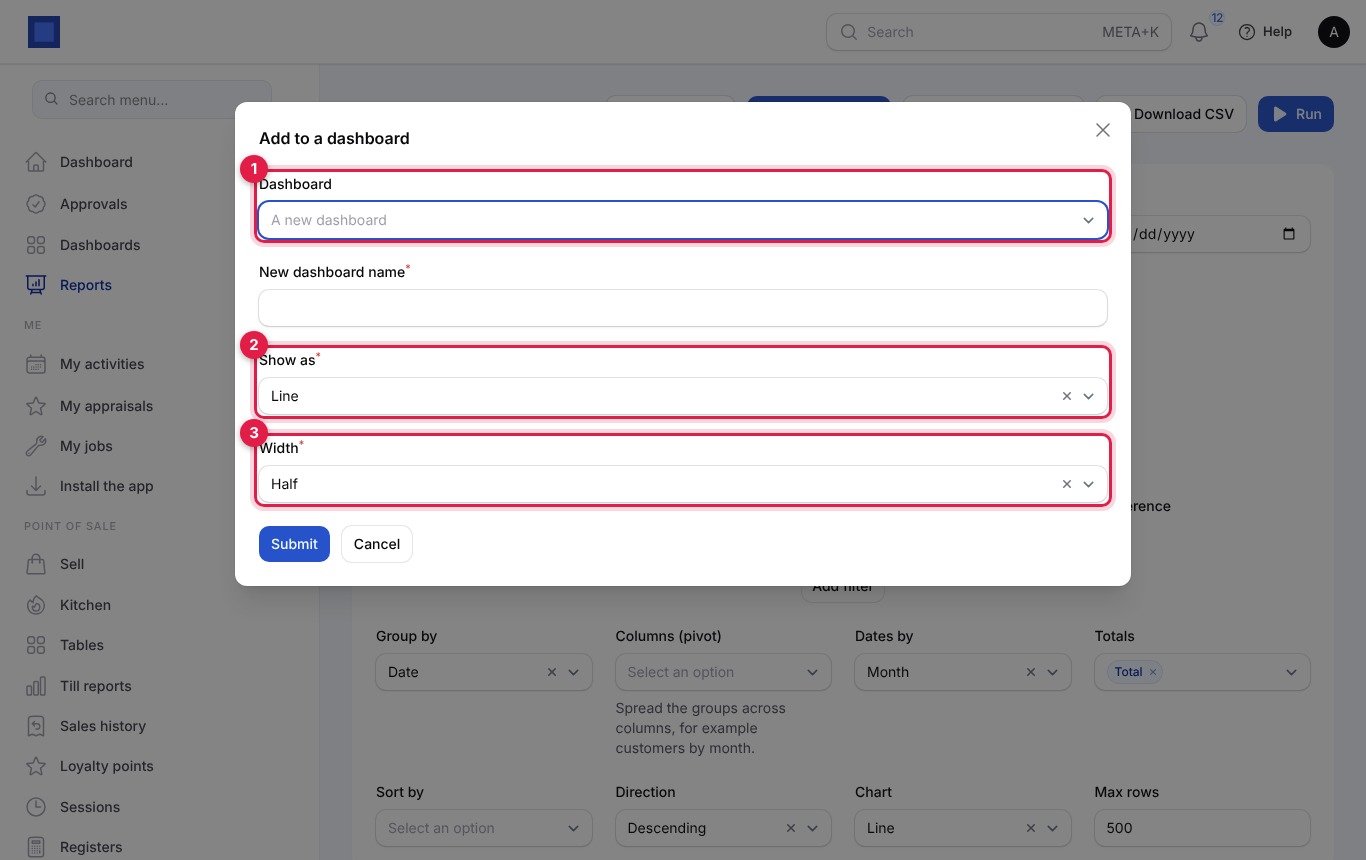
- Choose the Dashboard (marker 1), or leave A new dashboard and type a New dashboard name.
- Choose how to Show as (marker 2): Number (one big total, good for "Invoiced this year"), Table, Bars, Pie or Line.
- Choose the Width (marker 3): Half or Full width of the dashboard.
- Click Submit. The message has an Open button to go to the dashboard.
Publish a saved report as a live data feed
A data feed turns a saved report into a secret web address that Google Sheets, Excel, Power BI or Looker Studio read the latest figures from, so a spreadsheet or BI report stays up to date without anyone downloading a CSV again. You need core.reports.manage.
Turn the feed on
- Open the saved report (see Open a saved report), or save the report first. Data feed (marker 1) only appears once the report is saved.
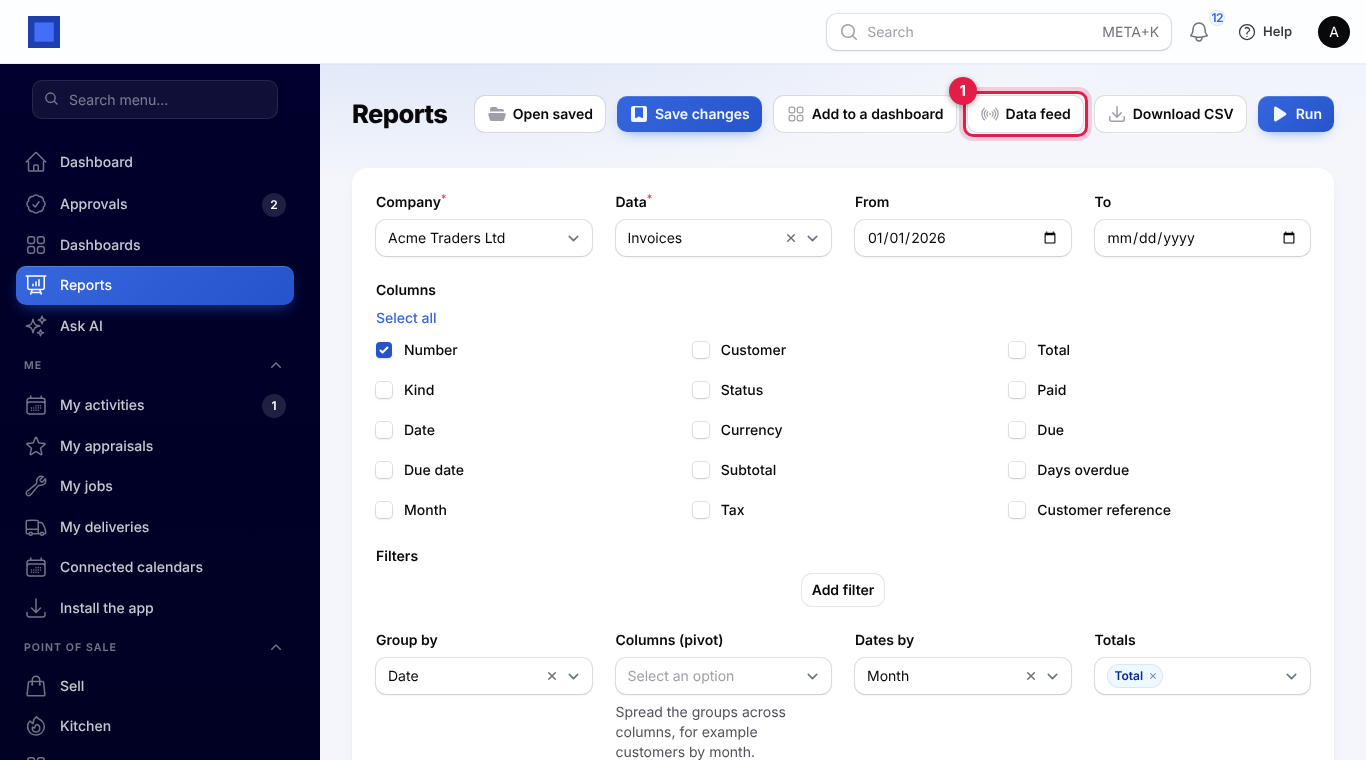
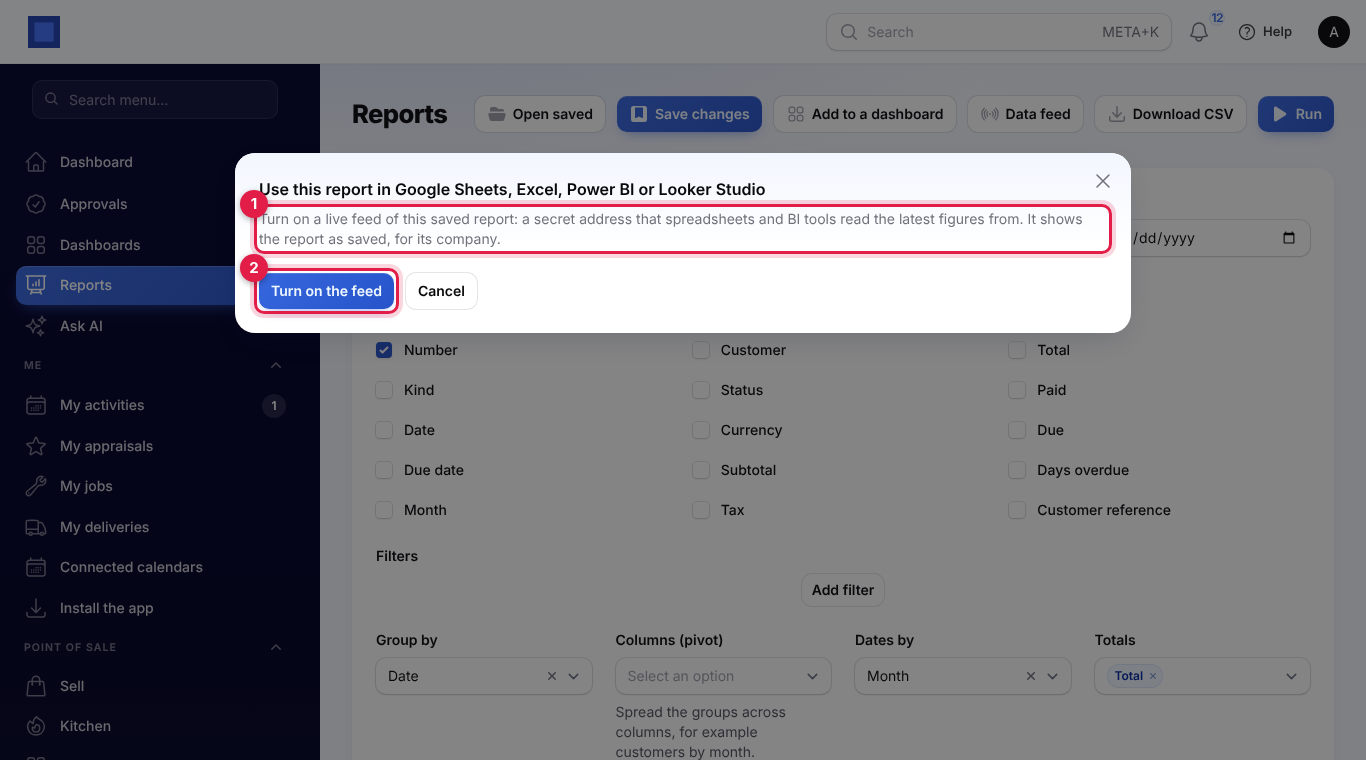
- Click Data feed. The window explains what the feed is (marker 1).
- Click Turn on the feed (marker 2). You see "Feed turned on. Open Data feed again to copy its address."
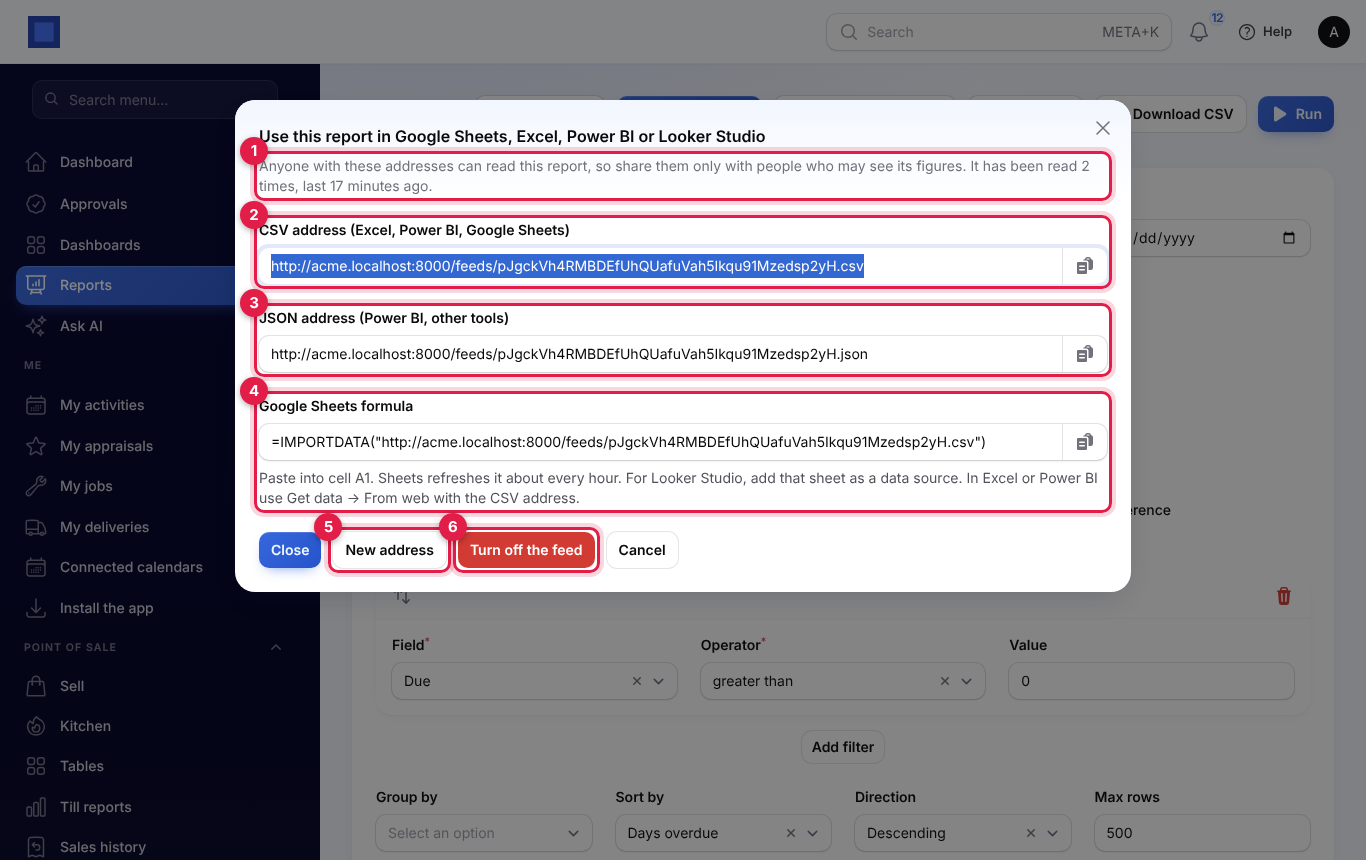
- Click Data feed again. It now shows how many times the feed has been read and when it was last read (marker 1), and three addresses, each with a copy button:
- CSV address (Excel, Power BI, Google Sheets) (marker 2), ending in
.csv. - JSON address (Power BI, other tools) (marker 3), ending in
.json. - Google Sheets formula (marker 4), ready to paste.
- CSV address (Excel, Power BI, Google Sheets) (marker 2), ending in
The feed shows the report as saved, for the company it was saved for: its columns, filters, grouping and sort. It is worked out afresh each time it is read. The CSV has a header row and the rows of the report, without the totals row; the JSON is a list with one record per row. If you change the report and click Save changes, the feed shows the new version at the same address.
Tip: The From and To dates are kept as saved. For a feed that always shows the latest figures, such as "unpaid invoices today" or "sales this year", leave To empty before you save the report.
Use it in Google Sheets
- Click the copy button next to Google Sheets formula.
- In a new Google Sheet, click cell A1 and paste. The formula looks like
=IMPORTDATA("https://yourbusiness.nalisuite.com/feeds/….csv"). - Press Enter. The report appears in the sheet. Google Sheets reads it again about every hour.
For Looker Studio, build the sheet above and add it as a Google Sheets data source in Looker Studio.
Use it in Excel or Power BI
- Copy the CSV address.
- In Excel, open Data → Get Data → From Other Sources → From Web. In Power BI Desktop, open Get data → Web.
- Paste the address, click OK, and choose Anonymous access if asked: the address itself is the key.
- Load the data. Click Refresh (or set a refresh schedule in Power BI) to read the latest figures.
Power BI and other tools that prefer JSON can use the JSON address in the same way.
Replace or stop the address
Anyone who has the address can read the report, without signing in, so share it only with people who may see its figures.
- New address (marker 5): makes a new secret address after you confirm. The old addresses stop working at once ("The old addresses stop working at once; update any sheet or report that uses them."). Use it if an address was shared with the wrong person, then paste the new one into your sheets.
- Turn off the feed (marker 6): stops the feed after you confirm. All its addresses stop working. You can turn it on again later; it then gets a new address.
A stopped or replaced address answers "not found". Each address can be read up to 60 times a minute.
View your dashboards
Click Dashboards at the top of the sidebar (marker 1). You see the dashboards meant for your role; if there are several, tabs along the top switch between them. Each widget is a saved report, run live each time you open the page, with its title and the data it comes from: a number widget (marker 3), a chart (marker 4), a table or a pivot. Edit dashboards (marker 2) opens the current dashboard's settings for people allowed to manage reports.
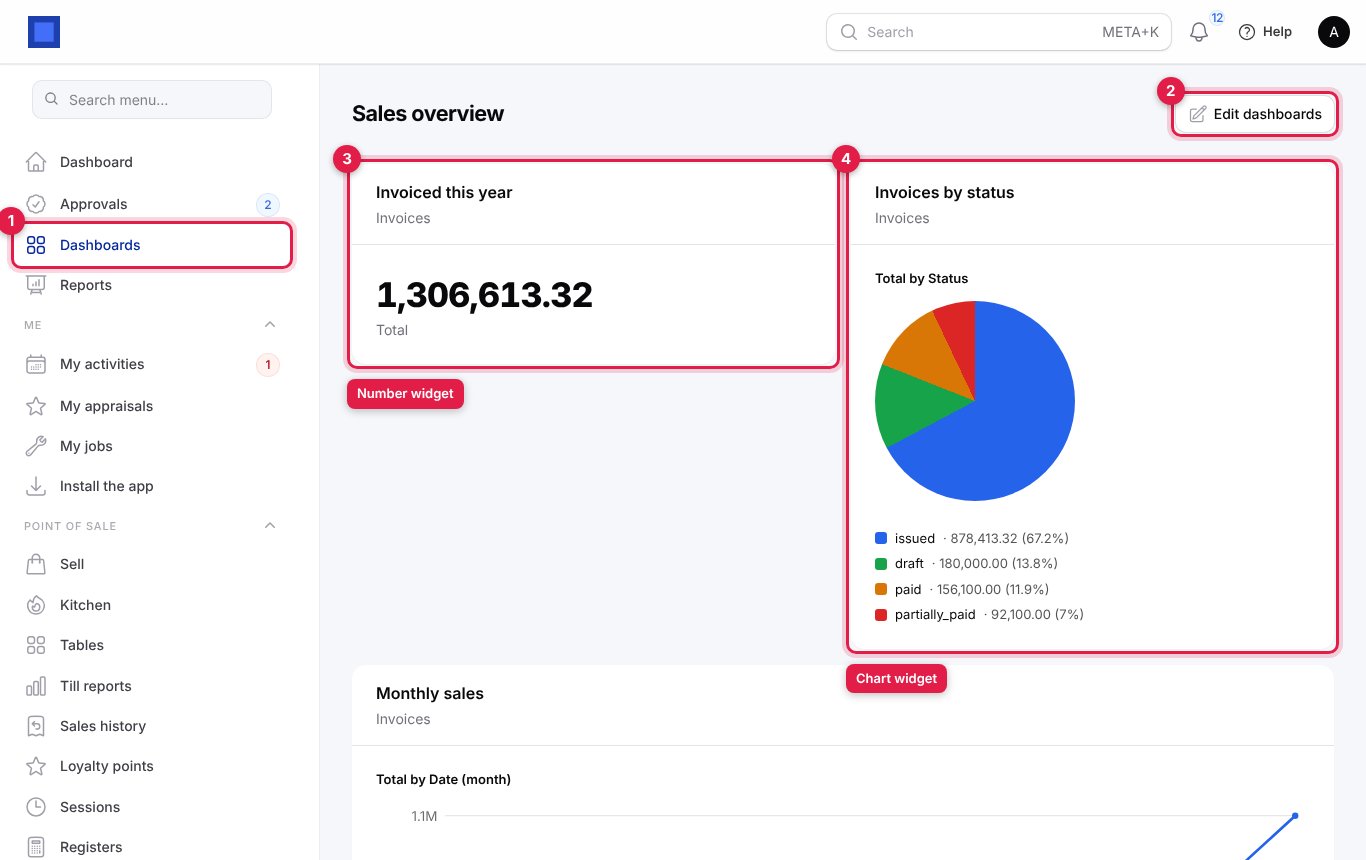
If nothing has been set up for you yet, the page says "No dashboard has been set up for you yet." The Dashboards menu item only appears when there is a dashboard for you, or when you can create one.
Set up dashboards for each role
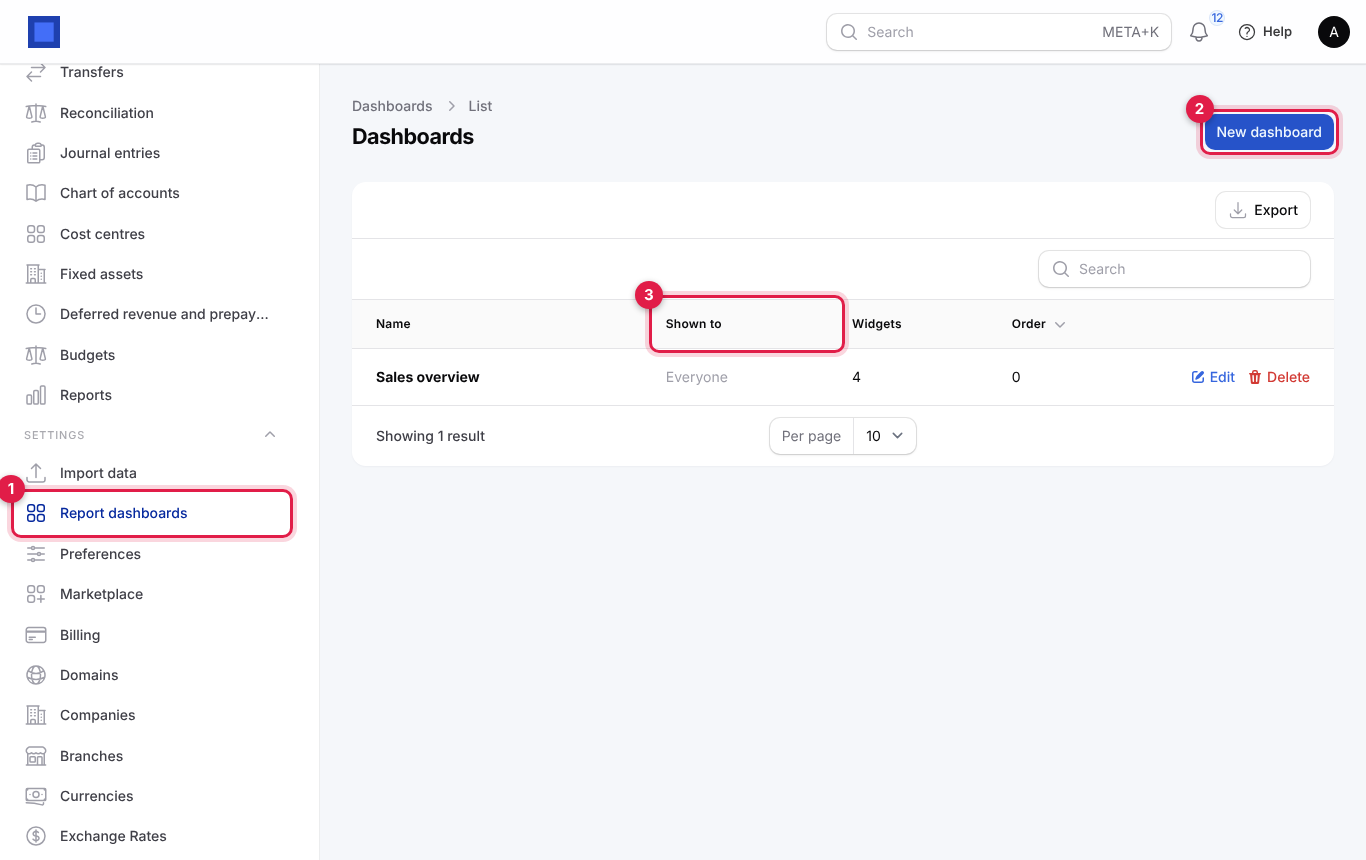
- Open Settings → Report dashboards (marker 1). Click New dashboard (marker 2), or Edit on an existing one. The Shown to column (marker 3) says which roles see each dashboard.
- Fill in the dashboard:
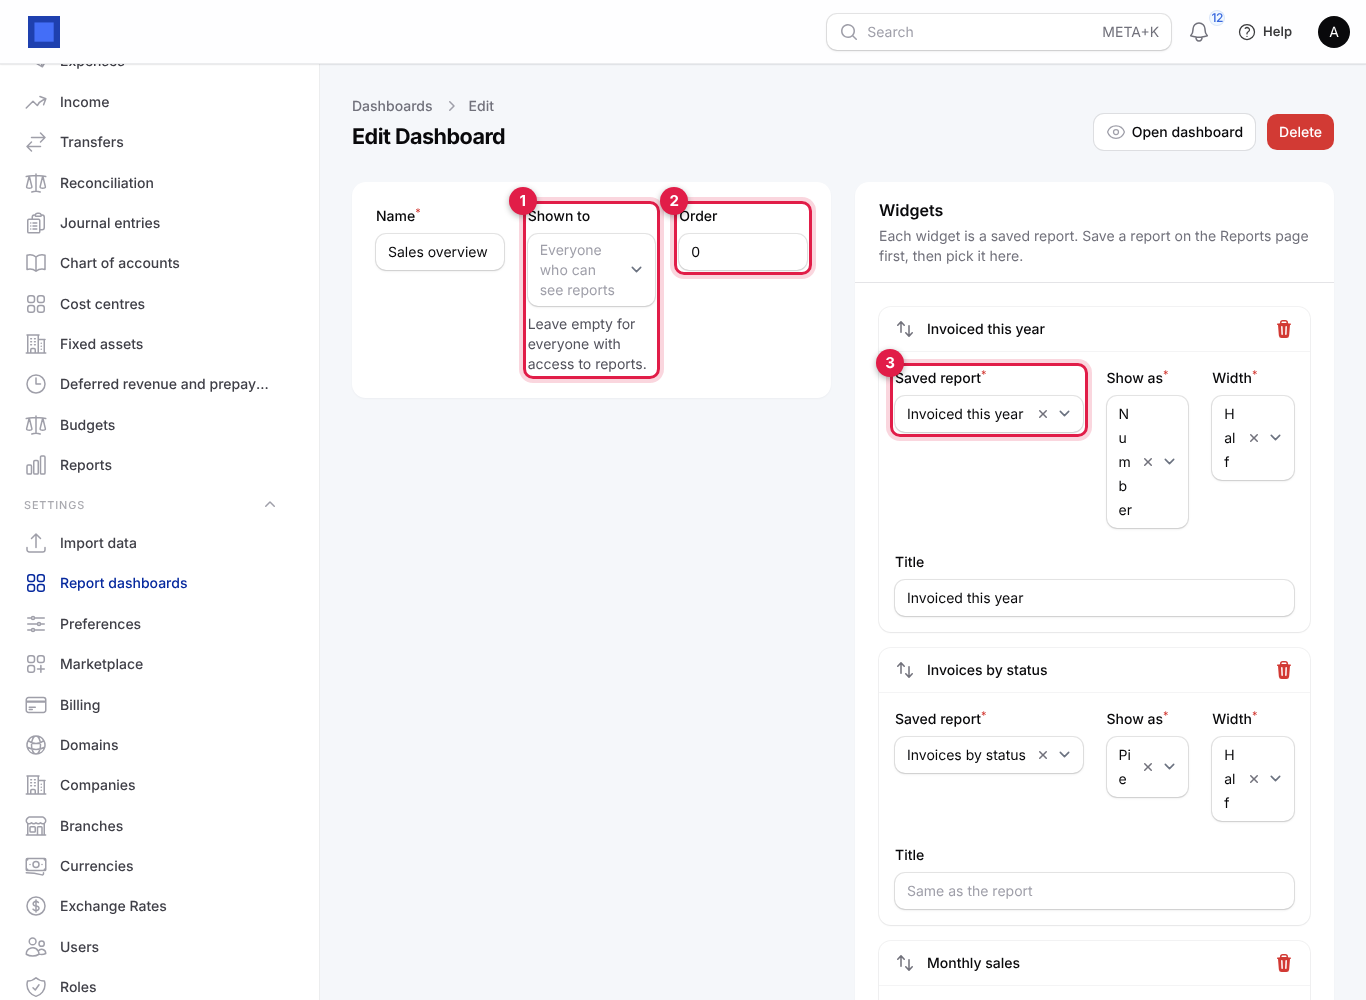
| Field | What to enter |
|---|---|
| Name | The dashboard title, for example Sales overview or Finance this month. Required. |
| Shown to (marker 1) | The roles that see it, for example Owner and Accountant for a finance dashboard, Member for a sales team board. Leave empty for everyone with access to reports. |
| Order (marker 2) | The order of the tabs when someone sees several dashboards; lower numbers first. |
| Widget Saved report (marker 3) | Any shared saved report (or your own). Save it on the Reports page first. Required. |
| Widget Show as | Number, Table, Bars, Pie or Line. |
| Widget Width | Half or Full. |
| Widget Title | Leave empty to use the report's name. |
- Click Add a widget (marker 4) for each report. Drag the arrows to reorder widgets; the bin removes one.
- Click Save changes (or Create). Open dashboard at the top shows the result; Delete removes the dashboard (the saved reports stay).
Tip: Good role dashboards: for the owner, Invoiced this year (number), Monthly sales (line) and Outstanding invoices by customer (table); for the accountant, Bills due this month and Expenses by category; for the sales team, Leads by stage and Quotations this month.
Common questions
Why is a column empty or a dataset missing? Datasets only appear for modules your workspace uses, and only for people allowed to see that module.
My report shows only 200 rows. Raise Max rows (up to 5,000), or group the rows. Download CSV downloads what the report returns, so raise Max rows before downloading a long list.
Does a dashboard update by itself? Yes. Widgets run their report each time the dashboard is opened, so they always show current figures.
Who receives the scheduled email? Only the addresses in To. The email is sent even if nobody opens NaliSuite that day.
Can I stop a scheduled email? Open the saved report, click Save changes, set Email it to Never and submit.
Can I see a report for all companies together? The report builder works per company. For consolidated financial statements use Accounting → Reports with All companies.